The S&P 500 hit an all-time high on Thursday, trading above 5300 for the first time in its history. This milestone has garnered significant attention, but what does it really mean for investors?
Well, when the market hits a record high, people typically see it in one of two ways. Either we’re in the midst of a strong bull market with further gains ahead, or the market is overly inflated, making a summer slump inevitable. Which of these perspectives you lean towards often depends on one’s general outlook on life, according to Martin Tillier, a financial advisor at Nasdaq. Optimists might see this as a signal that the market will keep rising, while pessimists might be more wary, fearing that the high levels indicate a bubble about to burst.
For many, their view of the market is influenced by their political beliefs as well. Democrats, for example, might see the market’s strength as evidence of a robust economy benefiting everyone, expecting further gains. Republicans, on the other hand, might interpret the high levels as a sign of excessive federal spending creating unsustainable gains, viewing the market as a bubble on the verge of popping.
However, if you’re considering reassessing your investments in light of these new highs, it’s crucial to be aware of these influences and try to discount them. Emotion and politics are two of the worst bases for investment decisions. They lead to extreme, binary views of the market when, in reality, multiple things can be true simultaneously.
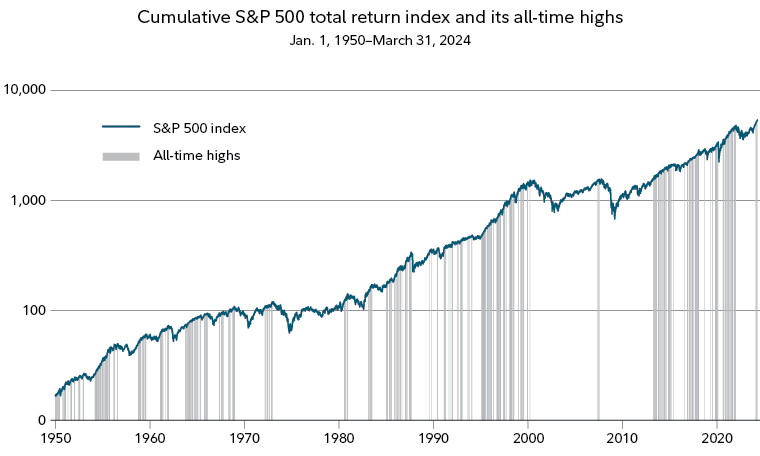
If we look back at history since 1950, the average total return for the S&P 500 index in the year following an all-time high was 12.7%, compared to 12.4% for other 12-month periods. Each time the S&P 500 reached an all-time high, the market often pushed even higher, reaching new all-time highs thereafter. If an investor took an all-time high as a sign that it’s time to get out of the market or to shift to a more conservative asset allocation, they would have likely missed out on further significant gains in the stock market.

Image/data Credit: fidelity.com
Stock valuations are pretty high right now, but they can still go up. However, a noticeable pullback is bound to happen at some point. The economy might look strong, but that could be partly due to government spending. Some people argue that this spending and the borrowing that funds it are good because they promote growth, which, along with rising wages, has helped many Americans. Still, the federal debt will need to be dealt with eventually, and the longer we wait, the more painful that adjustment could be when it comes.
If you’re investing for retirement or another long-term goal, remember that while all these factors are probably true, the timing remains uncertain. Does a 10% pullback matter if it comes after the market has gained 15%? What happens after the drop? Will stocks rebound quickly or stagnate at low levels? Will reducing the debt require harsh austerity measures, or will economic growth enable a more gradual repayment plan? These are all valid questions. When considering them together, Tillier suggests one clear plan of action for investors: do nothing, or as close to nothing as your emotions allow.
If you regularly contribute to your investments, keep doing so at the same rate. Don’t be tempted to sell in anticipation of a drop that might not happen for months. Now that 5300 has been breached, the most likely scenario is a new, higher trading range, meaning higher lows and higher highs for a while. Sit tight and let this be your friend.
One thing to note is that the gains up to this point haven’t been evenly distributed. Recent earnings reports have highlighted this disparity. For example, Walmart, a key retail stock, had a strong quarter, is investing in its future, and has a solid outlook. In contrast, leisurewear manufacturer and retailer Under Armor is cutting back. Caterpillar, an indicator of manufacturing conditions, expressed caution about the future, while Dell is increasing its capital expenditures to capitalize on the AI boom. It’s clearly a stock picker’s market, so adjusting your portfolio to favor stocks in solid companies in growth areas over those facing challenges might pay off.
This, however, is a short-term strategy. If you’re watching the market hitting these all-time highs and thinking, “I don’t want to buy at the top, I’ll wait until things cool down.” For long-term investors, the most important thing with the market at record highs is to stay invested. The economy has managed higher interest rates without much difficulty so far, and until that changes, the market will likely continue to rise. It might not be a smooth journey, but it never is. There’s no reason, aside from fear or political bias, to make any significant changes, even with record highs.

Image/data Credit: fidelity.com
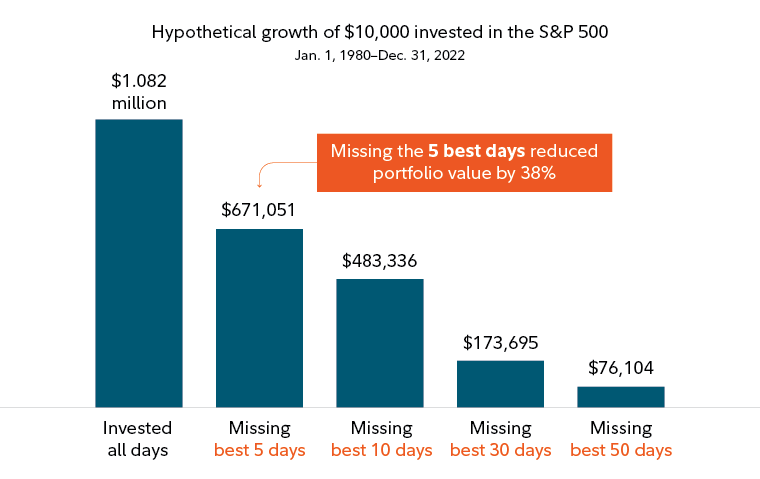
The chart above is almost enough to illustrate that waiting for the ‘right time’ may not be a prudent decision. In fact, timing the market is extremely difficult, if not impossible.
“I have never seen a reliable way of knowing the absolute best time to buy and sell the market day to day,” says Naveen Malwal, institutional portfolio manager with Strategic Advisers LLC.
It’s said, and is supported by historical data, that the best days in the market typically occur during times of market upheaval and increased volatility. Missing out on these advantageous moments can lead to a loss of substantial returns over time. Timing the market effectively requires skill, the right mindset, and a consistent performance history. If there were foolproof signals for market timing, they would be widely embraced.
So, it’s worth noting that you can’t predict what days will be good, as many market analysts suggest, and what days will be bad – trying to do so may lead you to make a big mistake, one that could be hard to recover from.
Stock market futures are showing mixed signals today (As of May 17, 2024 at 7:33 AM EDT), with S&P 500 and Nasdaq Composite futures fluctuating in premarket trading. The Dow Jones Industrial Average, after breaching the 40,000 point level on Thursday, is facing a slight retreat, with futures down 17 points, or less than 0.1%. This comes after the index shed 38 points on Thursday, finishing at 39,869. Meanwhile, S&P 500 futures are also marginally lower, while Nasdaq futures are up 0.1%. The yield on the 10-year U.S. Treasury note is holding steady at 4.38%.
[Disclaimer: The information provided in this article is for educational and informational purposes only. It should not be interpreted as investment advice or a recommendation to buy or sell securities. Investing in the stock market involves risk, including the potential loss of principal. Readers are encouraged to conduct their own research and consult with a qualified financial advisor before making any investment decisions. Past performance is not indicative of future results.]


