Is history going to repeat itself? Well… the answer isn’t that straightforward.
Stock market concentration refers to the degree to which a small number of companies or stocks dominate the total market capitalization or trading volume of a stock market. High concentration means that a few large companies have a significant impact on the overall market performance, while low concentration indicates a more even distribution of market influence among a larger number of companies.
Key aspects of stock market concentration include:
●Market Capitalization Concentration: The extent to which the total market value of a stock market is dominated by a few large companies.
●Trading Volume Concentration: The proportion of total trading volume accounted for by a small number of stocks.
●Sector Concentration: The degree to which specific industry sectors dominate the stock market.
In this article, we use the term ‘stock market concentration’ to refer to market capitalization concentration. Market capitalization concentration is particularly significant for the economy for several reasons:
Economic Representation: Large companies with significant market capitalization often represent key sectors of the economy. Their performance can reflect the overall economic health. For instance, if tech giants dominate the market, their growth or decline can significantly impact economic indicators.
Investment Flows: High market cap concentration can direct a large portion of investment flows toward a few companies. This can create a feedback loop where these companies receive more capital, further increasing their market dominance and potentially creating market imbalances.
Market Stability: A highly concentrated market can be more volatile. If the few dominant companies face financial troubles or sector-specific downturns, it can lead to significant market declines, affecting investor confidence and economic stability.
Impact on Smaller Companies: High concentration can make it difficult for smaller companies to attract investment, stifling innovation and growth in less dominant sectors of the economy. This can lead to a less dynamic economic environment.
Reduced Market Breadth: High concentration implies that a smaller number of stocks contribute to market movements. This can reduce the market’s overall breadth, making it less representative of the broader economy. Investors might find fewer opportunities for diversification, leading to higher risk in investment portfolios.
Top Decile vs Second Tier Concentration

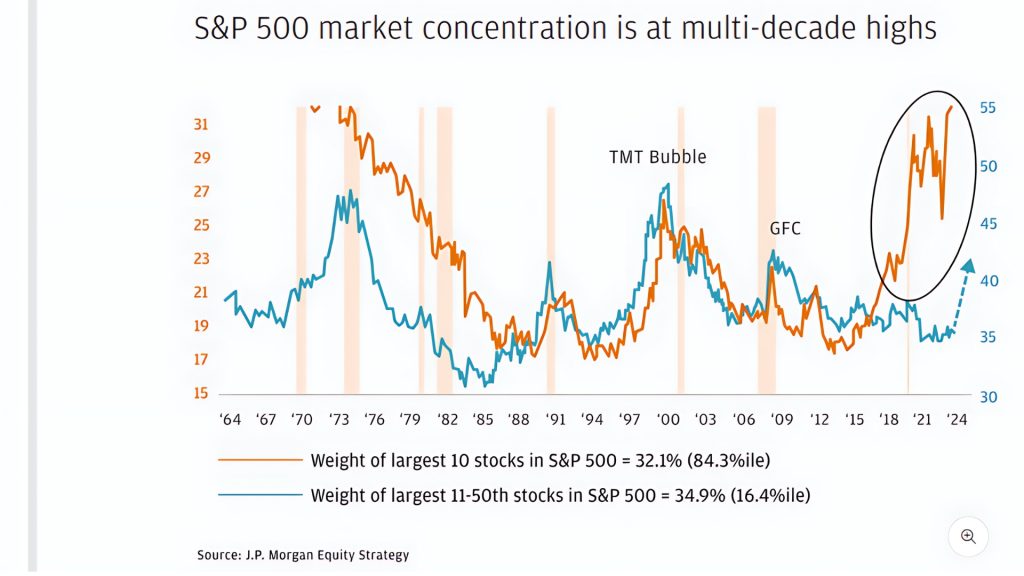
As of now, the ten leading stocks, including the notable “Magnificent 7” – Alphabet, Amazon, Apple, Meta Platforms, Microsoft, Nvidia, and Tesla – each surpassing a market value of $1 trillion, collectively comprise about 32% of the total market value. This is well above the 27% share reached at the peak of the tech bubble in 2000, a period characterized by a surge in the NASDAQ Composite Index, which soared by 400% from 1995 to its peak in March 2000, only to plummet by nearly 78% over the next two years as the bubble burst.

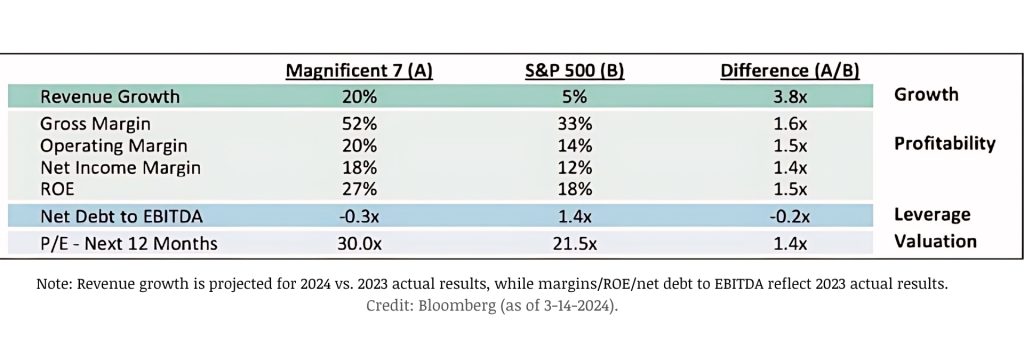
It’s no secret that the 7 tech giants have been fueling the current bullish market trend. Between January 2023 and April 2024, the stocks of the “Big 6 TECH+” companies – Apple, Amazon, Google, Meta, Microsoft, and Nvidia – rose by 117%. These companies include all but one of the Mag Seven stocks, excluding Tesla. Key financial health indicators, such as earnings per share (EPS), valuation multiples, and growth expectations are heavily influenced by these companies, which account for 25% of earnings. In late 2023, the 7s made up almost 44% of its top 10 holdings and traded at an average P/E ratio over 50, more than double the S&P 500’s ratio of just over 20 and nearly twice the Nasdaq 100’s ratio of around 28.
Top vs. Mid-Tier Concentration
Now, it becomes more concerning when we consider ‘concentration’ as the market cap of the largest stock relative to the 75th percentile stock. From this perspective, the current level of stock market concentration is notably similar to that seen during the Great Depression era.
The years pointed out in the chart below correspond to significant periods in economic and market history:

1932: This was during the Great Depression era, marked by severe economic downturn and market instability following the 1929 stock market crash
1964: This period saw economic expansion in the United States, part of the post-World War II economic boom.
1973: This year marked the beginning of a severe recession due to the oil crisis, which led to economic challenges globally.
2000: This corresponds to the dot-com bubble burst, where excessive speculation in technology stocks led to a market downturn
2009: Following the 2008 financial crisis, this year was a recovery period marked by significant government interventions to stabilize the economy.
2020: The onset of the COVID-19 pandemic triggered a global economic downturn and stock market volatility.
Observing the market cap of the top stock compared to the 75th percentile stock reveals important insights. It underscores which sectors or industries are driving a significant portion of the market’s total capitalization. If the top stock is from a specific sector and its market cap far exceeds that of the 75th percentile stock, it indicates that sector’s outsized influence on overall market valuation. Sector-specific issues, such as regulatory changes or technological disruptions, can disproportionately affect the entire market’s performance. It also indicates that economic power is concentrated in a few large companies. Dominant companies might have more pricing power, influence over suppliers and distributors, and greater ability to set industry standards.
Given the concerning chart comparing the historical levels of the top stock to the 75th percentile stock, it raises a critical question: is this a sign of another depression? To answer that, we must revisit the early 20th century.
The Great Depression: Causes and Consequences
From before the Great Depression through its aftermath and into subsequent years, the market was dominated by a few large companies and sectors, including General Electric (GE), General Motors (GM), U.S. Steel, Coca-Cola and Sears.
When one in twenty Americans were a shareholder in the early 1920s, the figure had risen to one in six by 1929. The pre-crash years were characterized by a craze for making quick money, and the best option for doing so was the stock market. Popular stocks were overvalued, and the market experienced a 37.88% annual increase in 1928. The peak was observed on September 3rd, underscored by the Dow Jones Industrial Average hitting a record high of 381.2 points.
Margin trading greatly heightened market fragility. This left investors heavily indebted and vulnerable to market swings. As stock prices plunged, investors faced margin calls, necessitating the sale of stocks at reduced prices to cover debts, exacerbating market turmoil.
From September 1 to November 30, 1929, the stock market lost over half of its value, from $64 billion to around $30 billion. The collapse of the stock market reverberated through the banking sector, with interconnected banks suffering significant losses from their stock investments. This interconnectedness led to a domino effect of bank failures. These failures eroded public confidence and sparked widespread bank runs, which further deepened the crisis.
Ultimately, it was the overvaluation, not concentration, that was identified as a major cause of the Great Depression’s triggering crash.
Following the crash, there was a significant decline over the next couple of years, with drops of 28.48% in 1930, and 47.07% in 1931. And just a year later, in 1932, stock market concentration reached its zenith, with the leading stock’s market cap surpassing that of the 75th percentile stock by over 700 times.
Economic Instability Isn’t Always Linked to Market Concentration
Over the past two centuries, the U.S. stock market has experienced varying degrees of concentration among its top companies. Despite recent trends showing increasing concentration, historical data suggests that such concentration does not inevitably lead to economic depression. Bryan Taylor, Chief Economist at Global Financial Data, provides an in-depth analysis of this phenomenon across distinct historical periods.
From 1790 to 1840, the U.S. stock market was dominated by the First and Second Banks of the United States, which controlled a significant share of market capitalization. However, as more companies were established, their dominance waned.

The period from 1840 to 1875 saw the rise of railroads as the dominant sector, with the Vermont Central Railroad being the largest company in 1845. By the end of the Civil War, transportation companies made up the top ten largest companies, representing over 20% of the stock market. The American Commercial Revolution from 1875 to 1929 introduced new industries like electric utilities, department stores, and automobile manufacturers, which diversified the market.
Speaking of recent times, the concentration has increased significantly due to the rapid integration of new technologies, which has favored large-cap stocks. While the level of concentration may initially raise concerns—especially as top-versus-mid-tier concentration has now reached levels not seen since the Great Depression, evoking memories of 1929—it alone is not necessarily indicative of another market crash, but it does not rule anything out either.
Nevertheless, the catastrophic Great Depression was not solely the consequence of stock market concentration; it was influenced by multiple factors, including missteps by the Federal Reserve, oversupply, overproduction, under-consumption, and banking failures. In the mid-1920, 28,885 banks were in operation. At the end of 1929, the number of banks had declined to 23,712 (Federal Reserve Board, 1932, p. 53)


Are Farms the New 401k? – Investmentals
[…] about having enough food made folks rethink how we farm. Also, given the uncertain economy and the current level of stock market concentration, which rivals that of the Great Depression, more people have started to think about alternative […]